Understanding the Kubernetes Node
本文永久链接: https://www.xtplayer.cn/kubernetes/understanding-the-kubernetes-node/
Introduction
With over 48,000 stars on GitHub, more than 75,000 commits, and with major contributors like Google and Red Hat, Kubernetes has rapidly taken over the container ecosystem to become the true leader of container orchestration platforms. Kubernetes offers great features like rolling and rollback of deployments, container health checks, automatic container recovery, container auto-scaling based on metrics, service load balancing, service discovery (great for microservice architectures), and more. In this article, we will speak about some basic Kubernetes concepts and its master node architecture, concentrating on the node components.
Understanding Kubernetes and Its Abstractions
Kubernetes is an open-source orchestration engine for automating deployments, scaling, managing, and providing the infrastructure to host containerized applications. At the infrastructure level, a Kubernetes cluster is comprised of a set of physical or virtual machines, each acting in a specific role.
The master machines act as the brain of all operations and are charged with orchestrating containers that run on all of the node machines. Each node is equipped with a container runtime. The node receives instruction from the master and then takes actions to either create pods, delete them, or adjust networking rules.
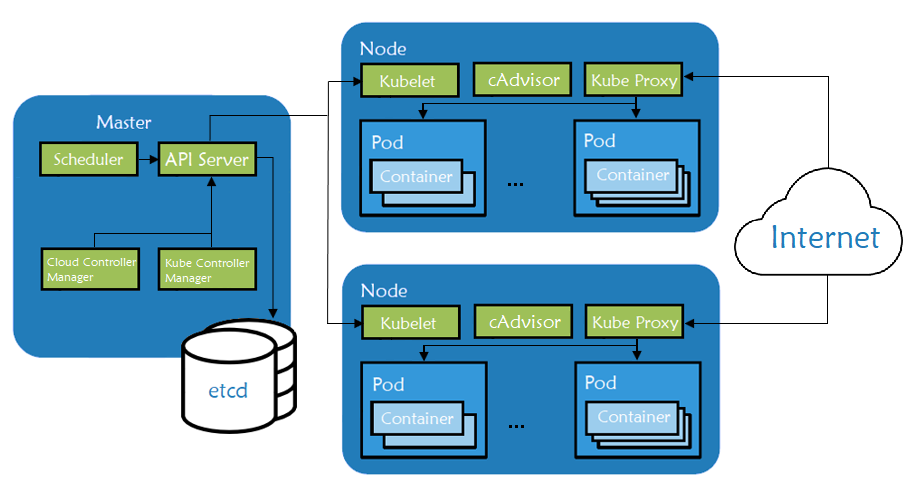 Fig. 1: Kubernetes node components architecture
- Master components are responsible for managing the Kubernetes cluster. They manage the life cycle of pods, the base unit of a deployment within a Kubernetes cluster. Master servers run the following components:
kube-apiserver- the main component, exposing APIs for the other master components.etcd- distributed key/value store which Kubernetes uses for persistent storage of all cluster information.kube-scheduler- uses information in the pod spec to decide on which node to run a pod.kube-controller-manager- responsible for node management (detecting if a node fails), pod replication, and endpoint creation.cloud-controller-manager- daemon acting like an abstraction layer between the APIs and the different cloud providers’ tools (storage volumes, load balancers etc.)
- Node components are worker machines in Kubernetes and are managed by the Master. A node may be a virtual machine (VM) or physical machine, and Kubernetes runs equally well on both types of systems. Each node contains the necessary components to run pods:
kubelet- watches the API server for pods on that node and makes sure they are runningcAdvisor- collects metrics about pods running on that particular nodekube-proxy- watches the API server for pods/services changes in order to maintain the network up to date- container runtime - responsible for managing container images and running containers on that node
Kubernetes Node Components in Detail
To summarize, the node runs the two most important components, the kubelet and the kube-proxy, as well as a container engine in charge of running the containerized applications.
kubelet
The kubelet agent handles all communication between the master and the node on which it is running. It receives commands from the master in the form of a manifest which defines the workload and the operating parameters. It interfaces with the container runtime that is responsible for creating, starting, and monitoring pods.
The kubelet also periodically executes any configured liveness probes and readiness checks. It constantly monitors the state of the pods and, in the event of a problem, launches a new instance instead. The kubelet also has an internal HTTP server exposing a read-only view at port 10255. There’s a health check endpoint at /healthz and also a few additional status endpoints. For example, we can get a list of running pods at /pods. We can also get specs of the machine the kubelet is running on at /spec.
kube-proxy
The kube-proxy component runs on each node and proxies UDP, TCP, and SCTP packets (it doesn’t understand HTTP). It maintains the network rules on the host and handles transmission of packets between pods, the host, and the outside world. It acts like a network proxy and load balancer for pods running on the node by implementing east/west load-balancing using NAT in iptables.
The kube-proxy process stands in between the network Kubernetes is attached to and the pods that are running on that particular node. It is essentially the core networking component of Kubernetes and is responsible for ensuring that communication is maintained efficiently across all elements of the cluster. When a user creates a Kubernetes service object, the kube-proxy instance is responsible to translate that object into meaningful rules in the local iptables rule set on the worker node. iptables is used to translate the virtual IP assigned to the service object to all of the pod IPs mapped by the service.
Container Runtime
The container runtime is responsible for pulling the images from public or private registries and running containers based on those images. The most popular engine is Docker, although Kubernetes supports container runtimes from rkt, runc and others. As previously mentioned, kubelet interacts directly with container runtime to start, stop, or delete containers.
cAdvisor
cAdvisor is an open-source agent that monitors resource usage and analyzes the performance of containers. Originally created by Google, cAdvisor is now integrated with kubelet.
The cAdvisor instance on each node collects, aggregates, processes, and exports metrics such as CPU, memory, file, and network usage for all running containers. All data is sent to the scheduler to ensure that it knows about the performance and resource usage inside of the node. This information is used to perform various orchestration tasks like scheduling, horizontal pod scaling, and managing container resource limits.
Observing Node Component Endpoints
Next, we will be installing a Kubernetes cluster (with the help of Rancher) so we can explore few of the APIs exposed by the node components. To perform this demo, we will need the following: - a Google Cloud Platform account, the free tier provided is more than enough (any other cloud should work the same) - a host where Rancher will be running (can be a personal PC/Mac or a VM in a public cloud) - on same host Google Cloud SDK should be installed along kubectl. Make sure that gcloud has access to your Google Cloud account by authenticating with your credentials (gcloud init and gcloud auth login). - Kubernetes cluster running on Google Kubernetes Engine (running EKS or AKS should be the same)
Starting a Rancher Instance
To begin, start a Rancher instance. There is a very intuitive getting started guide for Rancher that you can follow for this purpose.
Using Rancher to deploy a GKE cluster
Use Rancher to set up and configure your Kubernetes cluster, follow the how-to guide.
As soon as cluster is deployed, we can make a quick Nginx deployment to use for testing:
cat nginx_deployment.yaml |
In order to interact with Kubernetes API, we need to start a proxy server on your local machine:
kubectl proxy & |
Let’s check the progress to see it is running and listening to the default port:
netstat -anp | grep 8001 | grep LISTEN |
Now, in your browser, check the various endpoints that kubelet exposes:
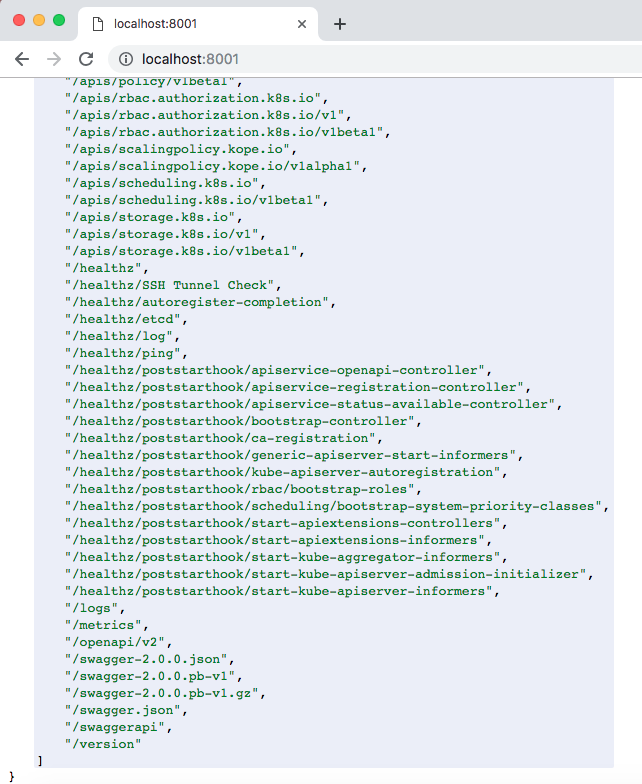
Fig. 2: kubelet API endpoints
Next, display the list of your cluster’s available nodes:
kubectl get nodes |
We can check the spec for any of the listed nodes using the API. In this example, we created a 3 node cluster, using the n1-standard-1 machine type (1 vCPU, 3.75GB RAM, root size disk of 10GB). We can confirm these specs by accessing the dedicated endpoint:
curl http://localhost:8001/api/v1/nodes/gke-c-cvknh-default-pool-fc8937e2-h2n9/proxy/spec/ |
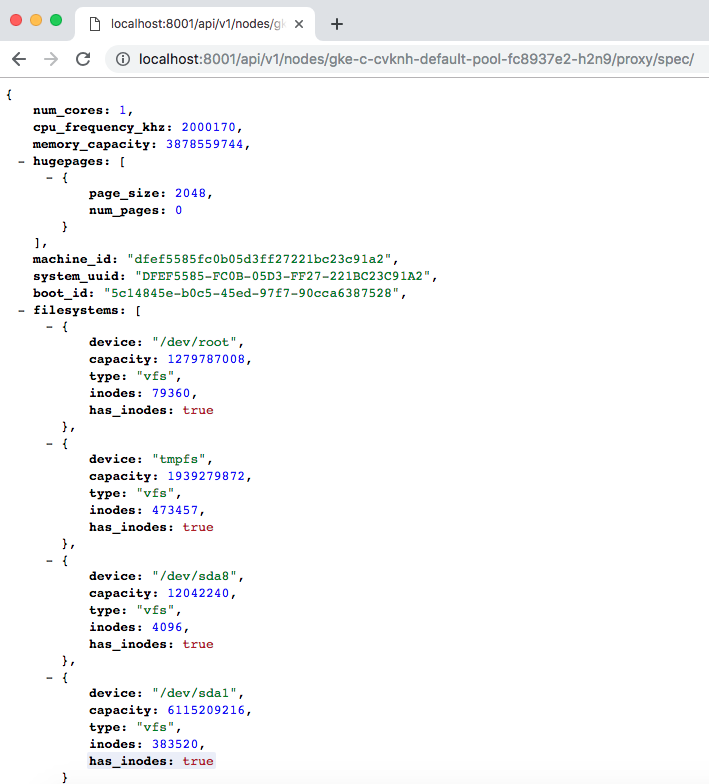
Fig. 3: Kubernetes node spec listing
Using same kubelet API with a different endpoint, we can check the Nginx pods we created to see what nodes they are running on.
First, list the running pods:
kubectl get pods |
Now, we can curl the /proxy/pods endpoint for each node to see the list of pods its running:
curl http://localhost:8001/api/v1/nodes/gke-c-cvknh-default-pool-fc8937e2-h2n9/proxy/pods |
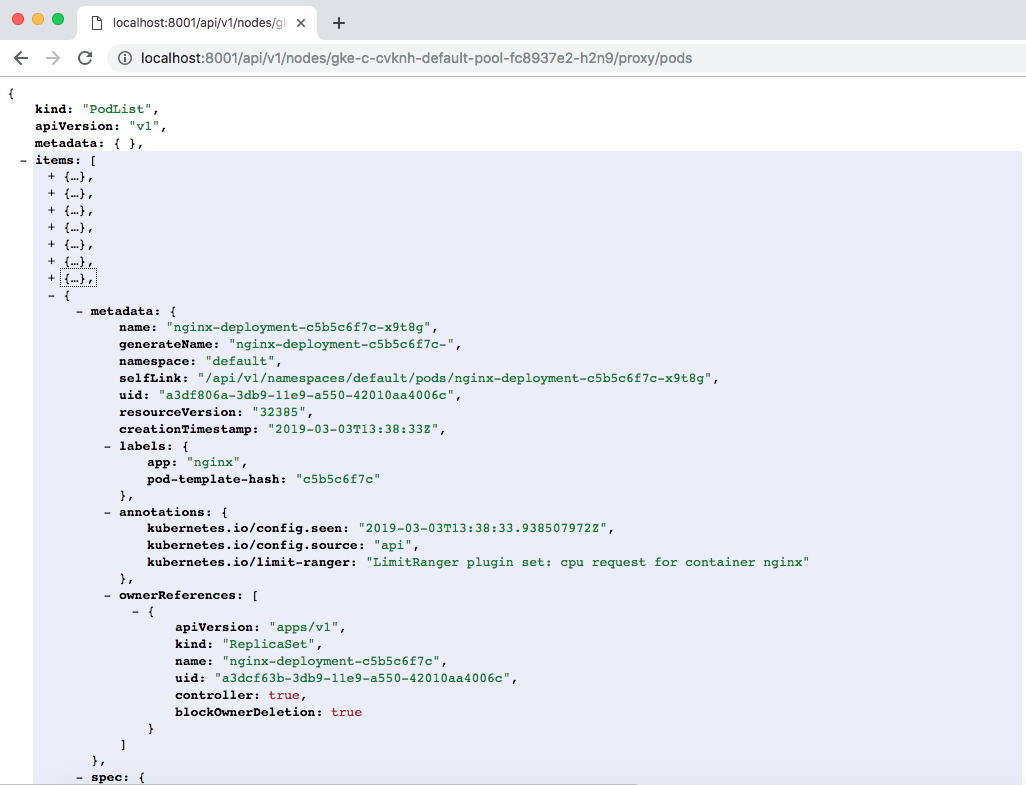
Fig. 4: Kubernetes node’s list of pods
We can also check the cAdvisor endpoint, which outputs lots of data in Prometheus format. By default, this is available at the /metrics HTTP endpoint:
curl http://localhost:8001/api/v1/nodes/gke-c-cvknh-default-pool-fc8937e2-h2n9/proxy/metrics/cadvisor |
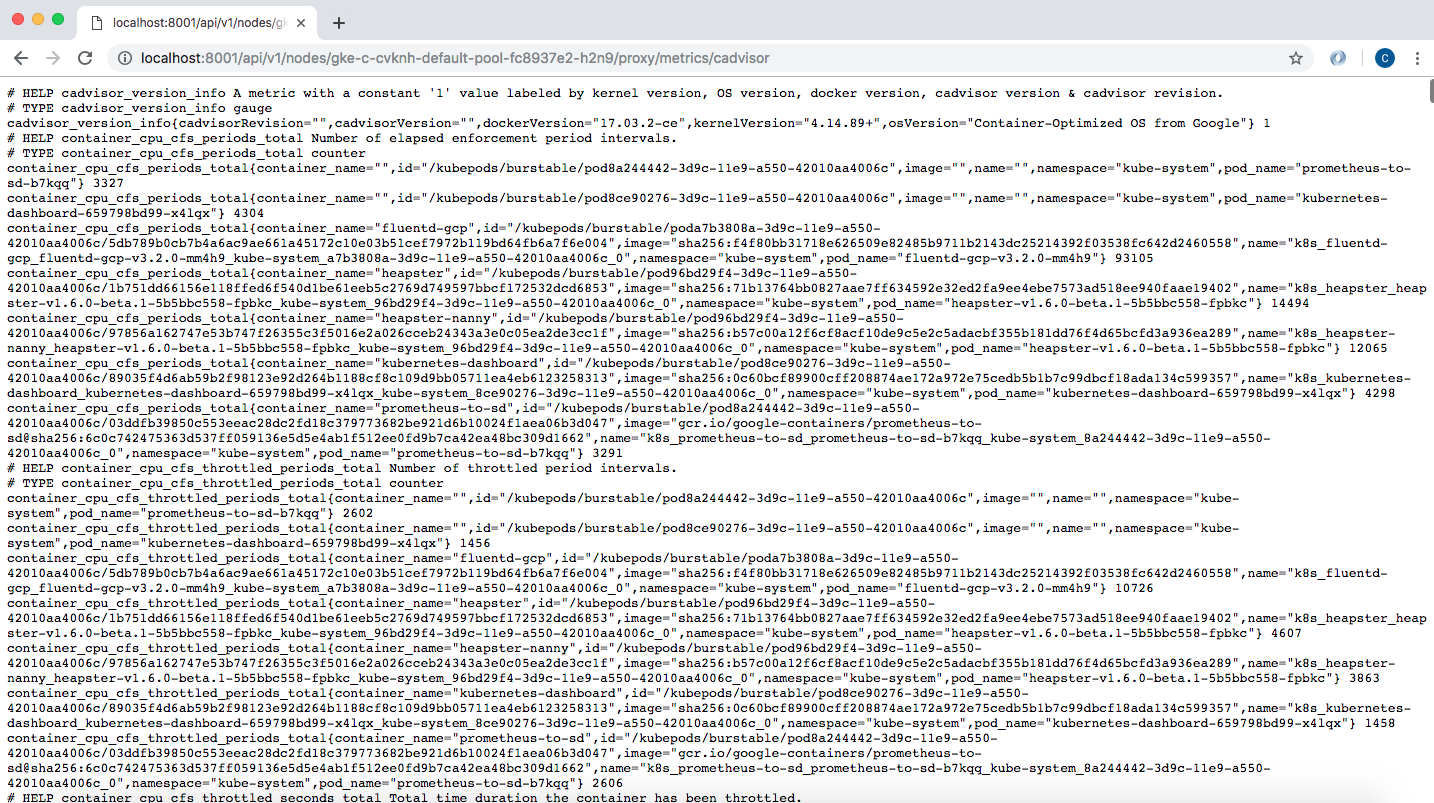
Fig. 5: Kubernetes /metrics endpoint
The same cAdvisor or pod information can also be obtained by SSHing into the node and making direct calls to the kubelet port:
gcloud compute ssh admin@gke-c-cvknh-default-pool-fc8937e2-h2n9 --zone europe-west4-c |
Cleanup
To clean up the resources we used in this article, let’s delete the Kubernetes cluster from Rancher UI (simply select the cluster and hit the Delete button). This will remove all the nodes our cluster was using, along with the associated IP addresses. If you used a VM in a public cloud to run Rancher, you will need to take care of that too. Find out your instance name, then delete it:
$ gcloud compute --project=<<YOUR_PROJECT_ID>> instances list |
Conclusions
In this article, we’ve discussed the key components of Kubernetes node machines. Afterwards, we deployed a Kubernetes cluster using Rancher and made a small deployment to help us play with the kubelet API. To learn more about Kubernetes and its architecture, a great starting point is the official documentation.


