本文永久链接: https://www.xtplayer.cn/prometheus/rancher-monitoring-migration-to-kube-prometheus-stack/

概述

根据 Rancher 官方文档说明,https://ranchermanager.docs.rancher.com/v2.15/integrations-in-rancher/monitoring-and-alerting/ ,从 Rancher v2.15 开始, Rancher monitoring 将发生重大架构变化,新的监控 Chart 由 rancher-monitoring 替换为 rancher-monitoring-dashboards。

新旧 Chart 的定位

Chart 名称 状态 说明
rancher-monitoring 旧版,已停止更新 Rancher 仅保留它来支持已有部署,不会有新功能或修复
rancher-monitoring-dashboards 新版,推荐使用 从 v2.15.0 起,新安装的监控都使用这个解耦后的 chart

新 Chart 的核心特点

rancher-monitoring-dashboards 不再捆绑安装完整的监控服务组件,比如 prometheus、Grafana,而是专注于两件事:

  • 提供 Grafana 仪表盘:预置了 Rancher 相关的监控面板。
  • 与 Rancher UI 集成:让这些仪表盘能在 Rancher 界面中正常展示。

不包含 kube-prometheus-stack 的镜像或组件,也不依赖 Rancher 自带的运行时,因此可以独立运行,不需要先安装旧的 rancher-monitoring。本质上,它安装的是一个只包含仪表盘的 rancher-monitoring 版本

使用前提

要切换到新 chart,需要满足两个条件:

  • 卸载旧的 rancher-monitoring chart:因为两者功能有重叠,不能共存。
  • 已有 Prometheus 基础设施:新 rancher-monitoring-dashboards chart 只负责展示,数据来源需要单独安装。官方支持多种配置,但**最简单的方式是安装 kube-prometheus-stack**。

迁移前准备

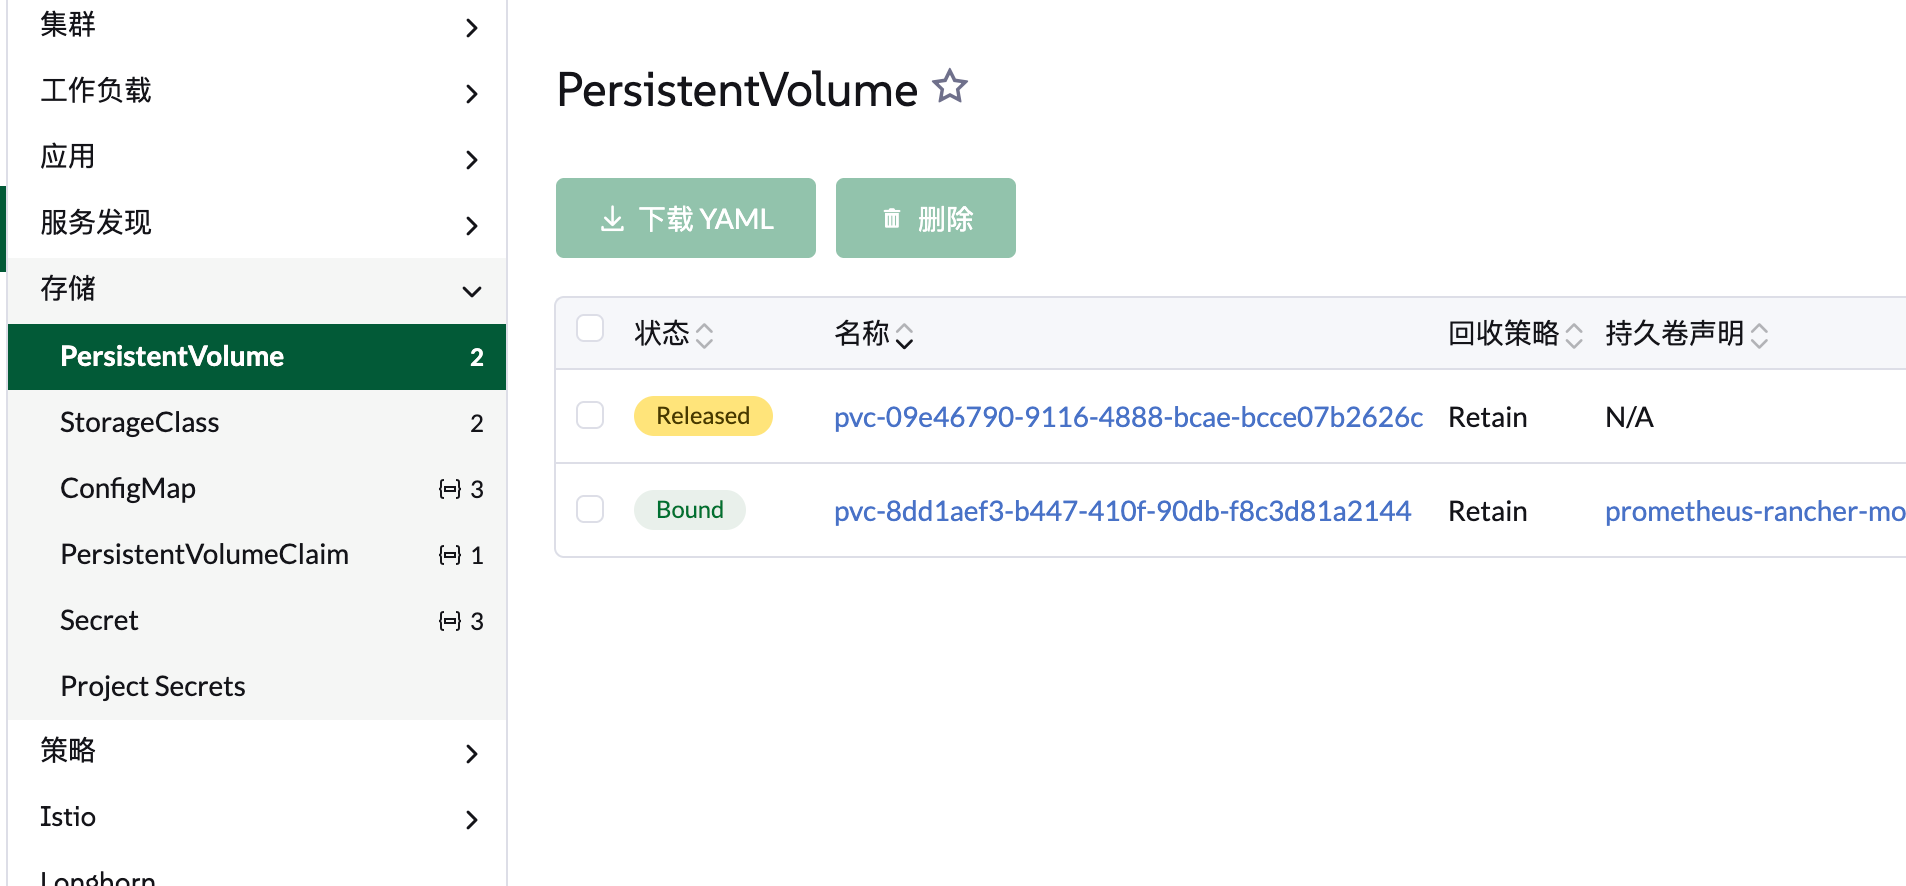
检查 PersistentVolume 保留策略

对于生产环境,通常是启用了 PersistentVolumeClaim 来保存数据。为了迁移到新版本之后数据不丢失,我们需要确保迁移之后可以复用以前的 PersistentVolume。

PersistentVolume 的 persistentVolumeReclaimPolicy 分为 Delete 和 Retain。如果监控相关 PersistentVolume 的 persistentVolumeReclaimPolicy 为 Delete,删除 PersistentVolumeClaim 时 PersistentVolume 会被一同删除。为了避免这种情况发生,需要检查旧版监控组件使用的 PersistentVolume 的 persistentVolumeReclaimPolicy 是否为 Retain。

如果 persistentVolumeReclaimPolicy 不为 Retain,可以使用以下命令去修改 persistentVolumeReclaimPolicy 。

kubectl patch pv <pv-name> -p '{"spec":{"persistentVolumeReclaimPolicy":"Retain"}}'

卸载旧版 Monitoring App

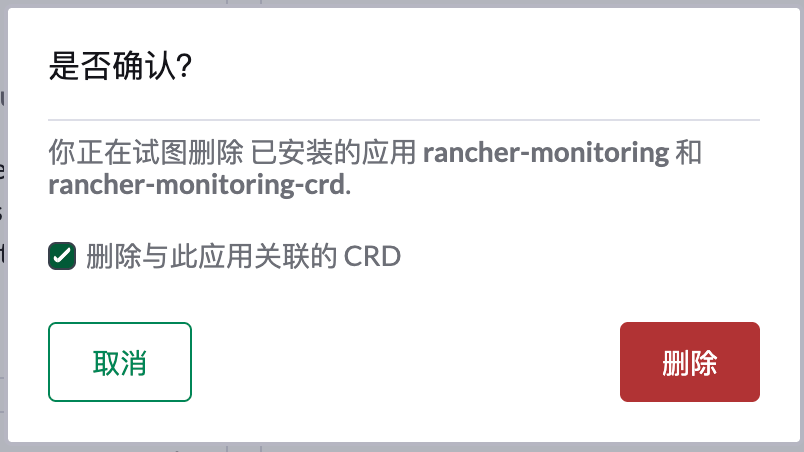
从 Rancher UI / 集群 Tools 中卸载 rancher-monitoring App,卸载的时候需要勾选 删除与此应用关联的 CRD,系统会自动删除监控相关的 CRD 资源,避免安装新版本后出现资源冲突。
删除旧版监控相关的 PersistentVolumeClaim

rancher-monitoring 和 kube-prometheus-stack 安装时,自动生成的 PersistentVolumeClaim 名称规则不一样。示例如下:

kube-prometheus-stack

prometheus:
prometheus-kube-prometheus-stack-prometheus-db-prometheus-kube-prometheus-stack-prometheus-0

grafana:
kube-prometheus-stack-grafana

rancher-monitoring

prometheus:
prometheus-rancher-monitoring-prometheus-db-prometheus-rancher-monitoring-prometheus-0

grafana:
rancher-prometheus-grafana

确保所有监控组件相关 PersistentVolume 的 persistentVolumeReclaimPolicy 为 Retain,然后删除所有旧版监控相关的 PersistentVolumeClaim。

释放并复用 Released 状态的 PersistentVolume

旧版监控组件相关的 PersistentVolumeClaim 被删除,因为 PersistentVolume 的 persistentVolumeReclaimPolicy 为 Retain,PersistentVolume 状态将变为 Released

为了能够复用该 PersistentVolume,执行下面命令移除其绑定声明引用,使其变为可用状态。

kubectl patch pv <PV名称> --type=json -p='[{"op":"remove","path":"/spec/claimRef"}]'

创建 kube-prometheus-stack 能识别的 PersistentVolumeClaim

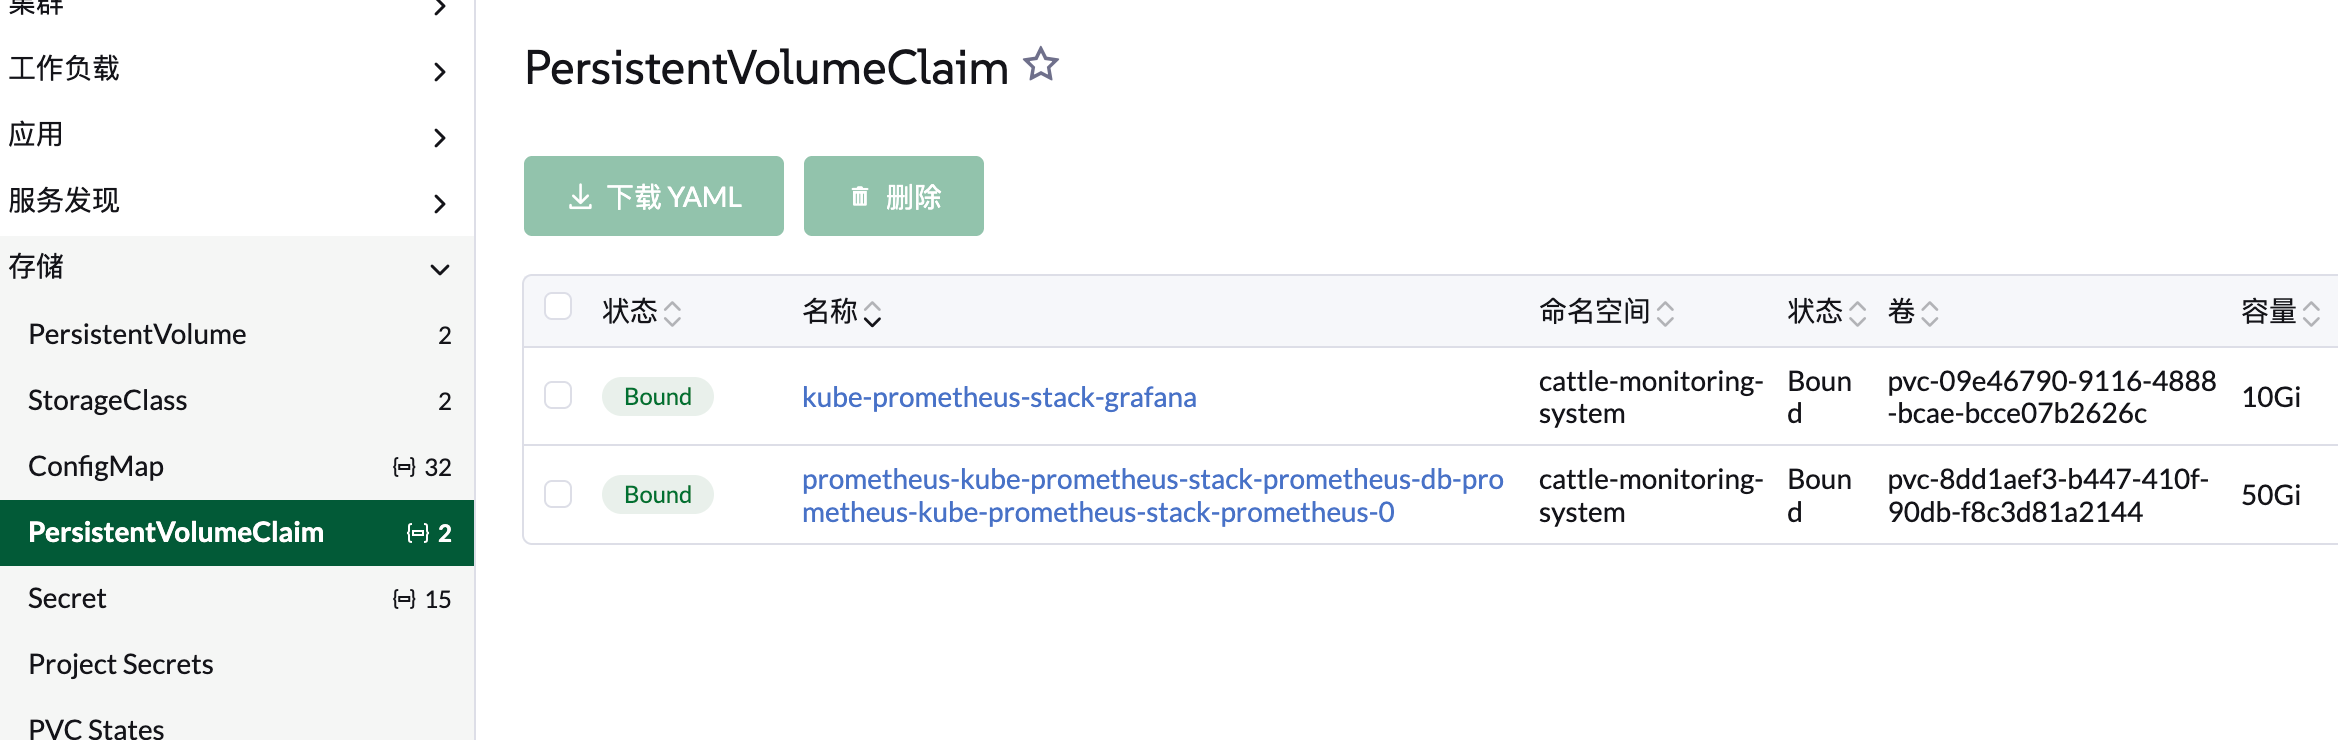
为了让 kube-prometheus-stack 安装时可以复用现有的 PersistentVolume,需要手动创建 PersistentVolumeClaim 并引用现有的 PersistentVolume。手动创建的 PersistentVolumeClaim 名称需要为 prometheus-kube-prometheus-stack-prometheus-db-prometheus-kube-prometheus-stack-prometheus-0 和 kube-prometheus-stack-grafana 。这样后续安装 kube-prometheus-stack ,将自动引用现有的 PersistentVolumeClaim。

  1. 在 Rancher UI \ 存储 \ PersistentVolumeClaim 页面,点击右侧创建按钮。

  2. 卷声明\源 选择使用现有的持久卷。

  3. 右侧持久卷选择复用的 PersistentVolume,此处可以根据原有 PersistentVolume 的大小来区分它是对应的哪个服务, 需要小心谨慎。

  4. 存储大小需要确保与 PersistentVolume 大小相同。

  5. PersistentVolumeClaim 创建完成后,会自动与该 PersistentVolume 完成绑定。
安装 kube-prometheus-stack

添加 chart 仓库

因为新版本监控 rancher-monitoring-dashboards Chart 中只包含展示相关的图表信息,数据收集组件(例如 prometheus 等)不再自动部署,需要手动安装。

helm repo add prometheus-community https://prometheus-community.github.io/helm-charts
helm repo update

自定义 value 配置

可以根据自己需要自定义 value 配置

namespaceOverride: cattle-monitoring-system

global:
## Global image registry to use if it needs to be overridden for some specific use cases (e.g. local registries, custom images, ...)
##
imageRegistry: ""

## Reference to one or more secrets to be used when pulling images
## ref: https://kubernetes.io/docs/tasks/configure-pod-container/pull-image-private-registry/
##
imagePullSecrets: []
# - name: "image-pull-secret"
# or
# - "image-pull-secret"

grafana:
initChownData:
image:
# 对应 grafana pod 中 init-chown-data 容器镜像
repository: docker.1ms.run/library/busybox
# tag: ""
pullPolicy: IfNotPresent
image:
# 对应 grafana pod 中 grafana 容器镜像
repository: docker.1ms.run/grafana/grafana
# tag: ""
pullPolicy: IfNotPresent
deploymentStrategy:
type: Recreate
service:
type: NodePort
defaultDashboardsTimezone: "browser"
# NOTE: Do NOT set root_url or serve_from_sub_path here
grafana.ini:
security:
allow_embedding: true
auth:
disable_login_form: false
auth.anonymous:
enabled: true
org_role: Viewer
dashboards:
default_home_dashboard_path: /tmp/dashboards/rancher-default-home.json
users:
auto_assign_org_role: Viewer
sidecar:
datasources:
enabled: true
image:
# 对应 grafana pod 中 grafana-sc-datasources 容器镜像
repository: quay.io/kiwigrid/k8s-sidecar
# tag: ""
dashboards:
enabled: true
label: grafana_dashboard
labelValue: "1"
# Allow discovery in all namespaces for dashboards
searchNamespace: ALL
image:
# 对应 grafana pod 中 grafana-sc-dashboard 容器镜像
repository: quay.io/kiwigrid/k8s-sidecar
# tag: ""
pullPolicy: IfNotPresent
persistence:
enabled: true
type: pvc
storageClassName: "longhorn" # 如果不设置,将使用默认存储类。如果以前创建的 PVC 不是由默认存储类创建,将导致无法绑定以前的 PVC/PV
#existingClaim: "storage-rancher-monitoring-grafana-0"
accessModes:
- ReadWriteOnce
size: 10Gi # 确保与以前的 PVC 大小一致

# Prometheus configuration to pick up all ServiceMonitors
prometheus:
prometheusSpec:
image:
registry: quay.io
repository: prometheus/prometheus
# tag: ""
pullPolicy: IfNotPresent
serviceMonitorSelectorNilUsesHelmValues: false
podMonitorSelectorNilUsesHelmValues: false
persistentVolumeClaimRetentionPolicy: {}
# whenDeleted: Retain
# whenScaled: Retain
## How long to retain metrics
##
retention: 10d
storageSpec:
volumeClaimTemplate:
spec:
storageClassName: "longhorn" # 如果不设置,将使用默认存储类。如果自启动 pvc 不是由默认存储类创建,将导致无法绑定以前的 PVC\PV
accessModes: ["ReadWriteOnce"]
resources:
requests:
storage: 50Gi # 确保与以前的 PVC 大小一致

prometheusOperator:
admissionWebhooks:
patch:
enabled: true
image:
registry: ghcr.io
repository: jkroepke/kube-webhook-certgen
tag: 1.8.8
sha: ""
pullPolicy: IfNotPresent
deployment:
image:
registry: quay.io
repository: prometheus-operator/admission-webhook
# if not set appVersion field from Chart.yaml is used
tag: ""
sha: ""
pullPolicy: IfNotPresent
image:
registry: quay.io
repository: prometheus-operator/prometheus-operator
# tag: ""
pullPolicy: IfNotPresent
prometheusConfigReloader:
image:
registry: quay.io
repository: prometheus-operator/prometheus-config-reloader
# if not set appVersion field from Chart.yaml is used
tag: ""
sha: ""
thanosImage:
registry: quay.io
repository: thanos/thanos
tag: v0.42.4
sha: ""

alertmanager:
alertmanagerSpec:
image:
registry: quay.io
repository: prometheus/alertmanager
# tag: ""
sha: ""
pullPolicy: IfNotPresent

prometheus-node-exporter:
image:
registry: quay.io
repository: prometheus/node-exporter
# tag: ""
pullPolicy: IfNotPresent

crds:
enabled: true
## The CRD upgrade job mitigates the limitation of helm not being able to upgrade CRDs.
## The job will apply the CRDs to the cluster before the operator is deployed, using helm hooks.
## It deploys a corresponding clusterrole, clusterrolebinding and serviceaccount to apply the CRDs.
## This feature is in preview, off by default and may change in the future.
upgradeJob:
enabled: false
## Force apply the CRDs, taking ownership from the manager that installed them (e.g. helm).
## Required for the job to actually upgrade CRDs whose schema/version changed.
forceConflicts: true
image:
busybox:
registry: docker.1ms.run
repository: busybox
tag: "latest"
sha: ""
pullPolicy: IfNotPresent
kubectl:
registry: registry.k8s.io
repository: kubectl
tag: "" # defaults to the Kubernetes version
sha: ""
pullPolicy: IfNotPresent

kube-state-metrics:
image:
# 对应 kube-prometheus-stack-kube-state-metrics pod 容器镜像
repository: swr.cn-north-4.myhuaweicloud.com/ddn-k8s/registry.k8s.io/kube-state-metrics/kube-state-metrics
# tag: ''
pullPolicy: IfNotPresent

# No metric exporter by default
kubeEtcd:
enabled: false
kubeControllerManager:
enabled: false
kubeScheduler:
enabled: false
kubeProxy:
enabled: false

安装 kube-prometheus-stack

将上一步骤的 value 配置保存为 values.yaml 文件,然后执行以下命令进行安装。

helm upgrade --install kube-prometheus-stack prometheus-community/kube-prometheus-stack \
--namespace cattle-monitoring-system \
--create-namespace \
--debug \
-f values.yaml

安装 rancher-monitoring-dashboards

使用 Rancher UI 部署 Monitoring Dashboards Chart:

  1. 导航到 Cluster Management。
  2. 选择你的集群并点击 Explore 按钮。
  3. 在左侧菜单中选择 Apps > Charts。
  4. 找到 Monitoring Dashboards chart,点击 Install。
  5. 在 Project 下拉框选择你要安装到的项目名称,点击 Next。
  6. 根据实际集群类型进行选择,本文示例为 RKE2 集群,因此选择 RKE2,完成后点击 Install。

安装 PushProx 收集控制平面组件监控数据

默认情况下,kube-prometheus-stack 不会主动抓取 kubeEtcd、kubeControllerManager、kubeScheduler 或 kubeProxy 的指标。若要从这些组件导出指标,则必须额外部署 PushProx。

此部分的操作,请参考论坛文章: https://forums.rancher.cn/t/rancher-v2-15-kube-prometheus-stack-monitoring-dashboards-rke2/5297#rke2-pushprox-5